24 March 2026
Echoes from the Money Markets Q1 2026

Recent developments in money markets have been shaped by rising geopolitical tensions, particularly in the Middle East, and their impact on energy prices. Higher oil prices have reinforced inflation concerns and led markets to reassess the outlook for interest rates. This shift in expectations is visible across money market segments, from yield curves and derivatives to volatility and foreign exchange markets.
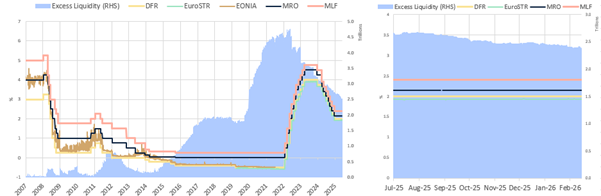
At its latest monetary policy meeting on 19 March 2026, the ECB kept its key interest rates unchanged at 2.00%, 2.15% and 2.40% for the deposit facility, main refinancing operations and marginal lending facility respectively. These levels have remained unchanged since 11 June 2025. At the same time, excess liquidity in the euro area continues its gradual decline, standing at EUR 2.40 trillion as of 13 March 2026.
📊 Chart 1 – Euro Area Key Interest Rates and Excess Liquidity Trends
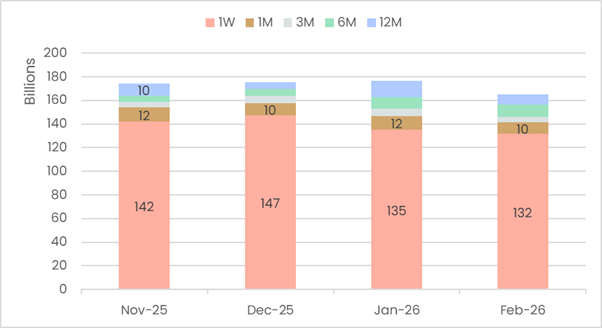
Against this backdrop, Euribor aggregated volumes reached EUR 165 billion in February 2026, down EUR 10 billion from the previous month. Volumes remain above February 2025 levels.
📊 Chart 2 – Euribor Aggregated Volumes
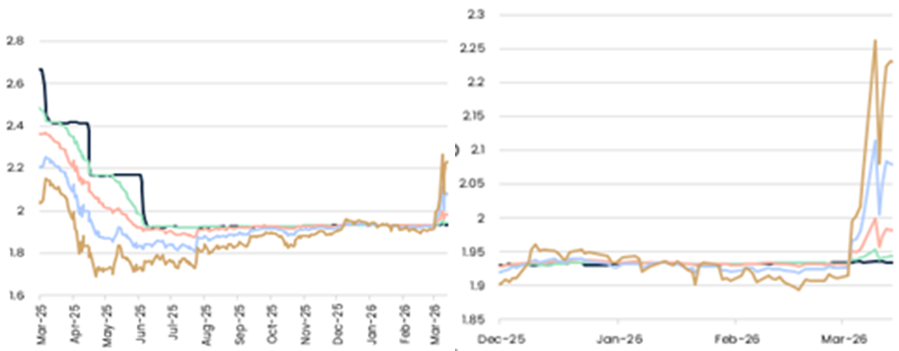
Since late February 2026, the Euribor curve has steepened markedly, reflecting market expectations that the ECB may implement up to three rate hikes by year-end in response to rising inflation concerns.
📊 Chart 3 – Euribor Forward Curve Evolution
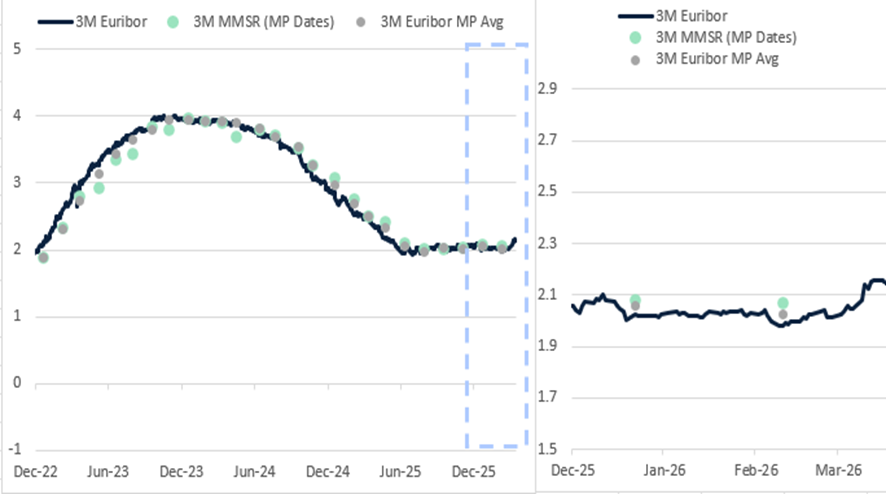
3M Euribor (average MP) and 3M MMSR (average MP) rates have continued to move closely together throughout the period under review. During the 8th maintenance period of 2025 (23 December 2025 – 10 February 2026), the spread between the two averaged around 4 basis points.
📊 Chart 4 – 3M Euribor vs MMSR Average Rates
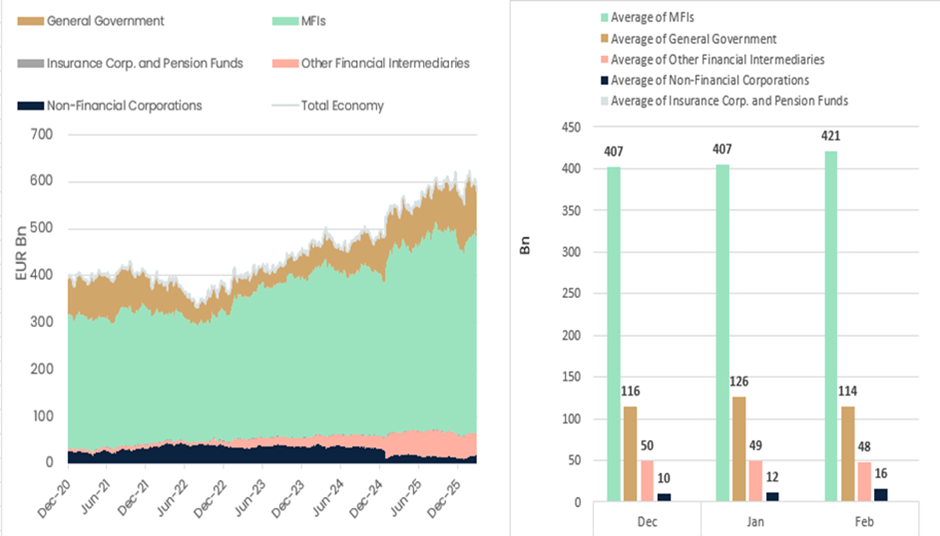
In parallel, STEP markets remain stable. On 6 March 2026, total STEP daily outstanding amounted to EUR 579 billion. Outstanding amounts are largely driven by the Monetary and Financial Institutions (MFIs) sector, which declined slightly compared to previous months. Since May 2025, most segments have shown an upward trend, with non-financial corporations and other financial intermediaries remaining broadly stable.
📊 Chart 5 – STEP Outstanding Amounts by Sector
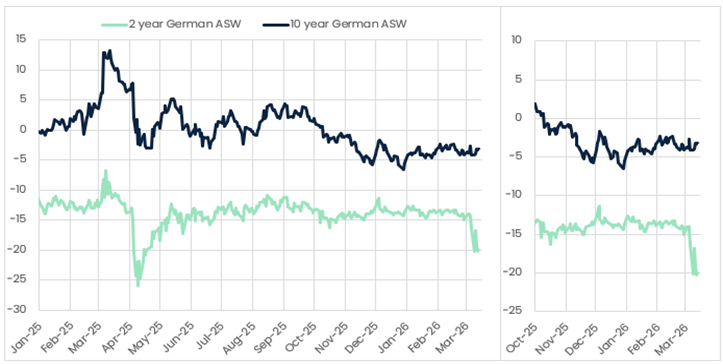
sset swap spreads (ASW) have also moved in response to recent market developments. The 2-year ASW spread declined sharply over the period. While this may partly reflect adjustments in interest rate expectations, it could also be linked to broader market dynamics, including shifts in risk sentiment and demand for high-quality collateral.
📊 Chart 6 – German 2-Year and 10-Year Asset Swap Spreads (ASW)
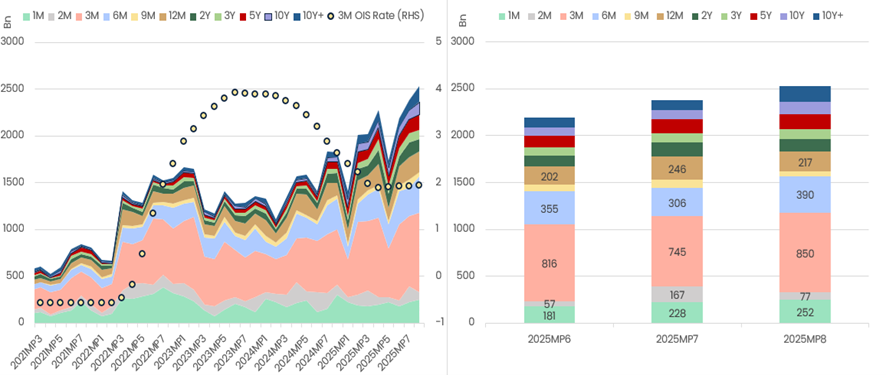
OIS activity has also increased. During the 8th maintenance period of 2025 (23 December 2025 – 10 February 2026), total OIS volumes reached EUR 2.6 trillion, with spot volumes at their highest level in the past five years. This upward trend may continue as more recent data becomes available, particularly in a context of evolving rate expectations linked to higher energy prices.
📊 Chart 7 – OIS Volumes (Spot and Forward)
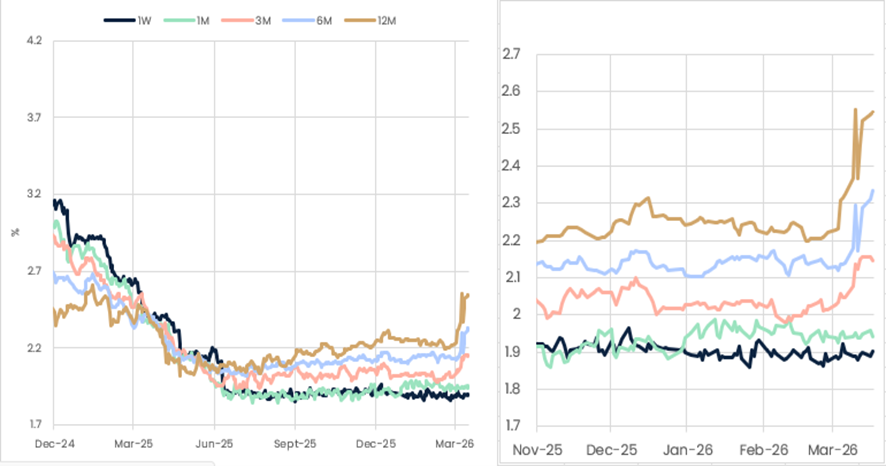
Short-term rates have reacted accordingly. €STR forward (EFTERM) rates increased significantly, driven by higher interest rate expectations in a context of rising oil and natural gas prices. Rates remain elevated at 1.982%, 2.080% and 2.232% for the 3-, 6- and 12-month tenors respectively.
📊 Chart 8 – €STR Forward (EFTERM) Rates by Tenor
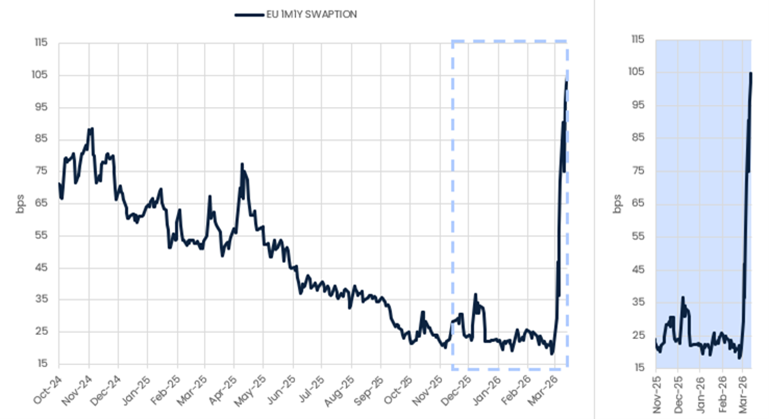
Market volatility has also risen sharply. The escalation of geopolitical tensions, including the conflict involving Iran and disruptions in the Strait of Hormuz, led to a significant increase in interest rate volatility. The 1M1Y swaption on the 3M Euribor rose from 21 basis points on 27 February to 105 basis points on 13 March, marking its highest level since February 2023.
📊 Chart 9 – Interest Rate Volatility (1M1Y Swaption on 3M Euribor)
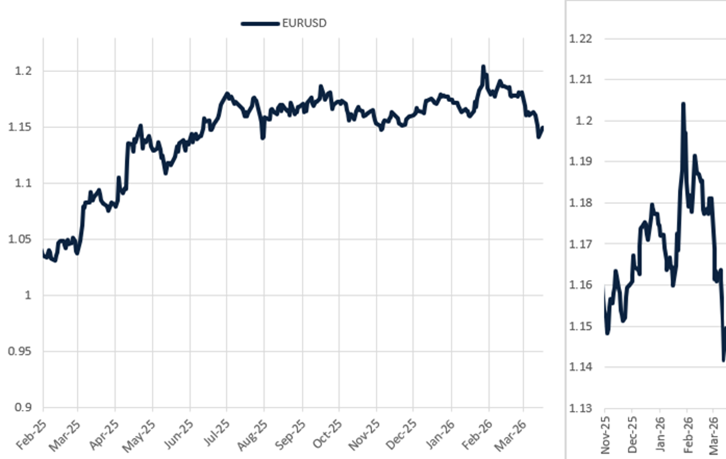
These developments have also affected foreign exchange markets. The euro has weakened against the US dollar, with the EUR/USD exchange rate at 1.142 on 13 March. This reflects both the impact of higher energy prices on the euro area, given its reliance on energy imports, and a broader “risk-off” environment, which has increased demand for safe-haven assets such as the US dollar.
📊 Chart 10 – EUR/USD Exchange Rate